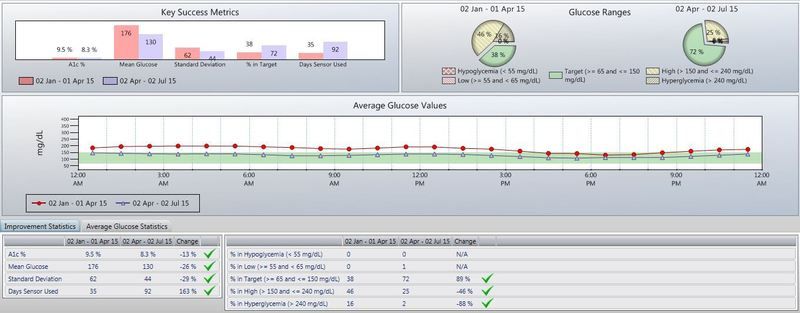
Anyway, I'd like to share some pretty exciting stats now. Check it out:

Here's the breakdown:
Jan 2 - April 1 = 62% high, 38% in target
April 2 - July 2 = 27% high, 1% low, 72% in target
That's an 89% improvement in maintaining my target blood sugars, and an 88% improvement in avoiding high blood sugars.
Jan 2 - April 1 = Average BG of 176
April 2 - July 2 = Average BG of 130
That's a 26% improvement in my average BG.
Now if I could just get that blue line a little bit lower, I'll be well on my way to a normal blood sugar average!
No comments:
Post a Comment